Thermal Throttling in GPU Clusters: How Heat Kills Your Throughput Silently
Nobody warns you about the slow decline. You deployed cleanly, your p50 latency looks fine, and somewhere around hour six of a sustained load test your throughput drops 8%. Then 11%. The model hasn't changed. The cluster hasn't changed. But something is absolutely wrong.
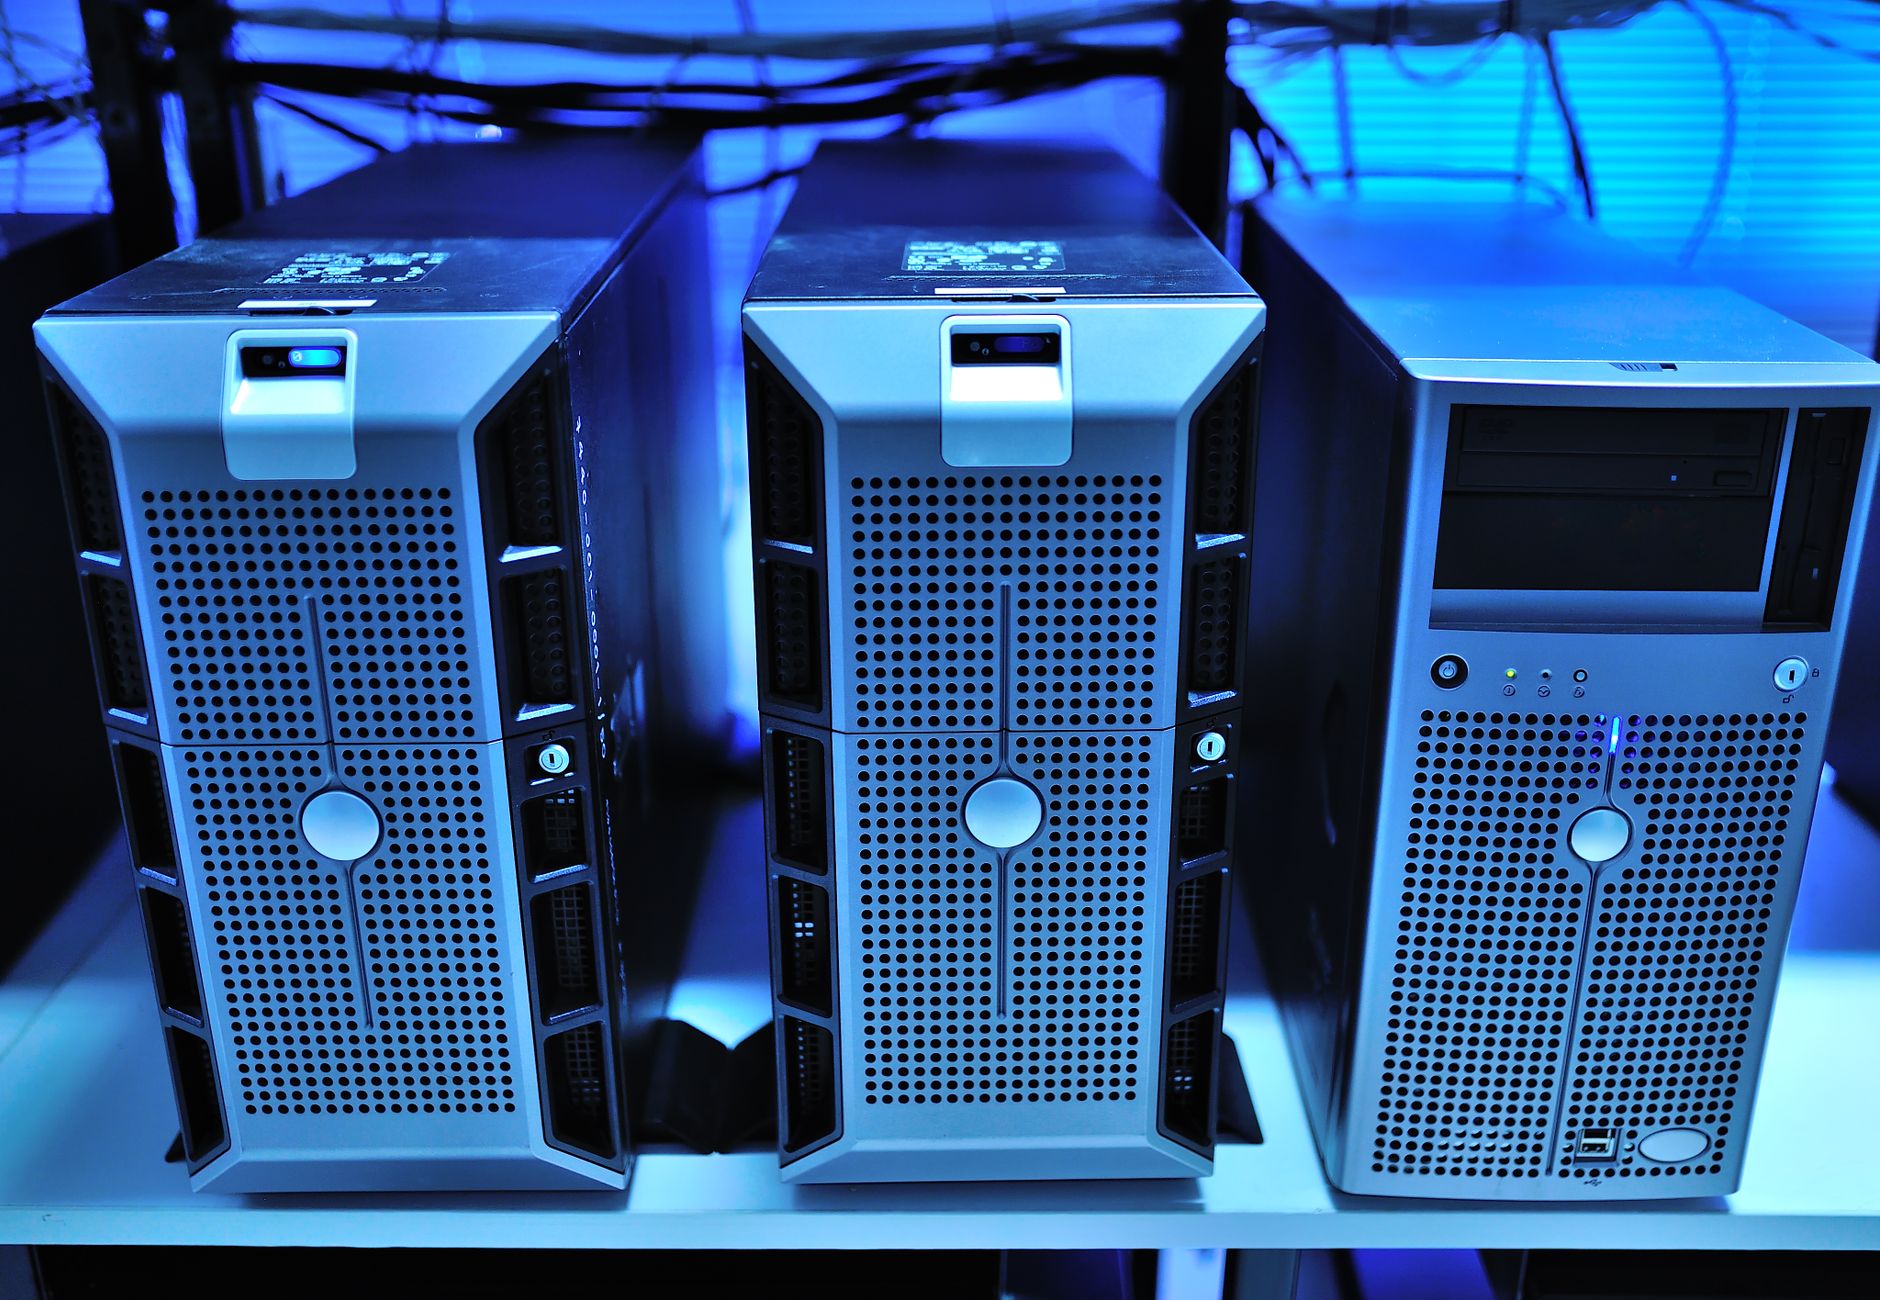 Photo by panumas nikhomkhai on Pexels.
Thermal throttling is the answer more often than people expect.
Modern GPUs (A100s, H100s, and their SXM variants especially) are designed to protect themselves by reducing clock frequencies when die temperature climbs past a threshold. On NVIDIA hardware this typically kicks in around 83-87°C for the GPU die, though the exact temperature varies by SKU and the throttling curve isn't a cliff: it's a ramp. You lose 50 MHz here, another 100 MHz there. The SM clock drops from 1410 MHz toward 1200 MHz, and your matrix multiply throughput follows it down proportionally. Nothing crashes. No alert fires. Your monitoring dashboard shows GPUs at 95% utilization and you feel good about efficiency while quietly leaving tokens per second on the floor.
The first thing to instrument is nvidia-smi dmon -s pctu, which streams per-GPU clock speed, temperature, and throttle reason codes every second. Throttle reason 0x4 is thermal; 0x8 is power. Both matter. You want this running continuously on every node and feeding into your time-series store (Prometheus with the nvidia_gpu_clock_events_count metric from the DCGM exporter covers this if you're already using DCGM). If you're not seeing throttle reason telemetry in your dashboards, you're flying without instruments.
Here's a simple picture of how the degradation chain works:
graph TD
    A[Sustained High Utilization] --> B(Die Temp Rises)
    B --> C{Throttle Threshold Crossed?}
    C -->|No| A
    C -->|Yes| D[SM Clock Reduced]
    D --> E(Tokens/sec Drops)
    E --> F[Latency Increases]
    F --> G{Load Shedding or Queue Buildup?}
What makes this particularly treacherous in dense clusters is that the problem compounds with physical placement. In an HGX H100 node with eight GPUs sharing a tray, GPUs 3 and 4 (middle of the board) run hotter than GPUs 0 and 7 at the edges. If you're distributing tensor-parallel shards across all eight, the whole model runs at the speed of the slowest shard. The middle GPUs throttle; everyone waits. You can verify this quickly by comparing nvidia-smi --query-gpu=index,temperature.gpu,clocks.sm --format=csv,noheader across the group. A spread of 10°C or more between the coolest and hottest GPU on the same node usually points to airflow problems or thermal interface degradation.
For inference workloads running FP8 or BF16 on H100s, the power draw during prefill on long sequences can spike fast enough to hit the per-GPU power cap (400W on SXM5) before temperature even becomes the constraint. Power throttling is actually more common than thermal throttling in well-cooled data centers, and the symptom is identical: clock frequency drops silently mid-request. Watch your nvidia_gpu_power_usage_milliwatts metrics against the cap and set an alert when any GPU sustains above 95% of its power limit for more than 30 seconds.
Three remediations worth knowing:
First, if you have flexibility in scheduling, prefer placing inference replicas such that tensor-parallel groups land on GPU pairs with similar thermal history. In Kubernetes with GPU topology hints, or with SLURM's --gres-flags=enforce-binding, you can pin jobs to specific GPU sets and avoid the hot-middle problem by round-robining replica placement across the physical topology.
Second, set the GPU persistence daemon (nvidia-persistenced) and lock application clocks via nvidia-smi --lock-gpu-clocks to a target frequency below the throttle threshold. You trade peak burst throughput for deterministic sustained throughput. Whether that's the right trade depends on your SLO shape, but for latency-sensitive serving it usually is.
Third, review your datacenter's rear-door heat exchangers or CRAC unit maintenance schedule. This sounds mundane. It is mundane. A partially blocked filter raises ambient rack temperature by 3-4°C and shifts your entire fleet toward the throttle threshold. Operational hygiene at the physical layer is part of the job.
Thermal behavior is model behavior. When your throughput looks like it's drifting, check the clocks before you check the code.
Get Omnissiah Systems in your inbox
New posts delivered directly. No spam.
No spam. Unsubscribe anytime.